The Size of the Largest Land Animal
J. E. I. HOKKANEN
Department of Theoretical Physics, University of Helsinki,
Siltavuorenpenger 20, SF-00170 Helsinki 17, Finland
(Received 27 July 1985)
The upper mass limit to terrestrial animals is studied using physical arguments and allometric laws for bone and muscle strength and animal locomotion. The limit is suggested to lie between 105 and 106 kg. A possibility for a still higher mass, in case of new adaptations, is not excluded.
1. Qualitative Mass Limits
Since Galilei (1637) it has been claimed that the 100-ton blue whale can reach its size only because of the supportive aid of water. Land animals of similar weight would be crushed by the earth's gravitational field. Recent measurements of land mammals and dinosaurs, with some help from elementary physics, can be used in evaluation of the upper limit to their mass.
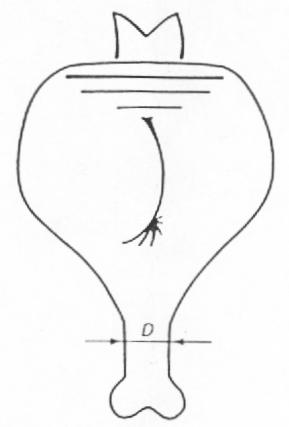
FIG. 1. An animal of mass M and leg bone diameter D.
For the kind of animals on land we know, a maximum weight necessarily exists. Let us examine, for the sake of simplicity, the case of the one-legged animal in Fig. 1. The force Mg due to the animal's mass M acting on a bone of diameter D and cross-sectional area A loads it in axial compression s
s
= (Mg/A)µ (M/D2) (1)µ
Denoting proportionality (g is the gravitational acceleration). Suppose our animal grows while keeping its shape unaltered. Constant shape means M µ D3, because D grows just like any other linear dimension of the animal. From equation (1), a steadily growing stress s µ D results, and the leg fails when s exceeds some critical value. To achieve a constant stress, the leg should scale as Mµ D. In the long run this will not do – the leg would soon be too thick and heavy for any use.Even more serious a limitation to animal size is the relative weakening of muscle strength. Stress in leg muscles obeys equation (1), too, but the relative size of muscles is more restricted, for the following reason: muscle mass Mm, like most morphological and physiological variables in biology, has so-called allometric dependence on body mass M
Mm = aMb (2)
where a, b are parameters to be determined from theory or measurements (see e.g. Schmidt-Nielsen, 1984). Now, the ratio Mm/M is about 0.4 irrespective of body size (Munro, 1969), so a 10 kg animal has 4 kg as Mm . According to the Dµ M1/2 law (b = 1.5) a 60 kg animal of the same shape would be nothing but muscle! A much weaker allometric dependence, b = 1.1, produces a large elephant (weighing 10 tons) of 80% muscle-bone would fill the rest of the body.
2. Quantitative Mass Limits
It is human nature to be curious about the exact mass for the biggest animal which could possibly survive on land. Were the biggest dinosaurs semiaquatic? Could they have been any bigger? In the last few years a study of mammal bone and muscle dimensions has been completed (Alexander et al., 1979, 1981). The material covers mammals from shrews to elephants. A comparison of dinosaur and extrapolated mammal leg bone dimensions is also available (Alexander, 1985). Quantitative results of bone failure and the relative weakening of muscle strength in large animals are derivable from the data.
(A) BONE FAILURE
Suppose M. is the mass producing the maximum compression in equation (1). It will then be the animal mass and the heaviest load the animal can carry combined. Denoting the allometric exponent for bone diameter D by d and using the proportionality from (1)
Mµ D2 (3)
we have for M.
Mx = aM2d (4)
Alexander et al (1979) found 0.32< d<0.38, so the value of 2d is below one and M grows faster than Mx. When M exceeds Mx, the animal collapses under its own weight. The parameter a remains to be found.
The strength of an animal is the strength of its weakest part. On the other hand, it would be poor economics to have some bones unnecessarily thick, so the bones involved tend to be under stresses of a kind. We choose here the tibia of a 50kg animal for our calculations. A bone can be considered as a hollow tube. The ratio of its inner and outer diameters is, for our animal, about 0.35 (Alexander, 1977). The allometric equations (with 95% confidence limits to exponents) for mammal bone length L and outer diameter D are
L=74× M0.32± 0.02, D = 4.8 M0.36± 0.02 (5)
where L and D are in mm and animal mass M in kg (Alexander et al., 1979), so the cross-sectional area of the tibia for an average 50 kg mammal is 2.7× 10⁻⁴. The compressive strength of bone is about 170 MPa (Fung, 1981), corresponding to 4600 kg for the tibia in vertical position.
The maximum load should contain a safety margin. The compressive stresses during fast running in leg bones of large animals like horses (Biewener et al., 1983), buffaloes and elephants (Alexander et al., 1979) correspond to the animal weight. The total dynamic stresses, mainly due to bending of the bones, exceed the pure compression by a factor of ten. Bending stresses in big animals can be kept down sufficiently by altering the ways of running. This effect is discussed later. Here the minimum value of a factor of safety for static compressive stress is taken to be ten – the tibia of the largest animal should then be able to support ten times the animal mass.
Remembering the safety margin, 460 kg is the load Mx, allowed for the 50kg animal. From (4), a = 27× 5 (in its own fractual units). Finally setting Mx=M = Mmax (see Fig. 2), Mmax denoting the maximum mass for a land animal, gives Mmax= 1.4 x 10⁵ kg. An animal bigger than this would create a stress more than one tenth of its maximum value, while standing on one leg.
How do parameter values affect Mmax? Changing 2d to its highest value of 0.76 between the 95% confidence limits makes Mmax four times bigger, while dropping the factor of safety to five raises Mmax one order. It is of importance to note that
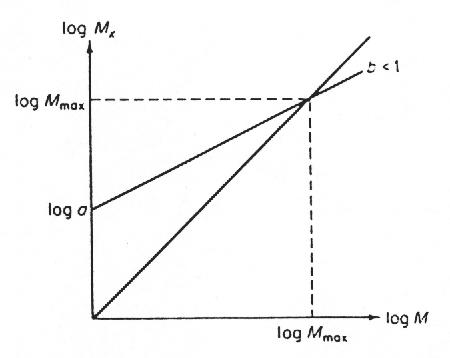
FIG. 2. The graphic determination of Mmax from Mx = aMb
even if dynamic stresses caused by movements would unrealistically be ignored, a considerable safety margin is still necessary. This is because a non-straight or non-axially loaded bone is likely to buckle (Fig. 3).
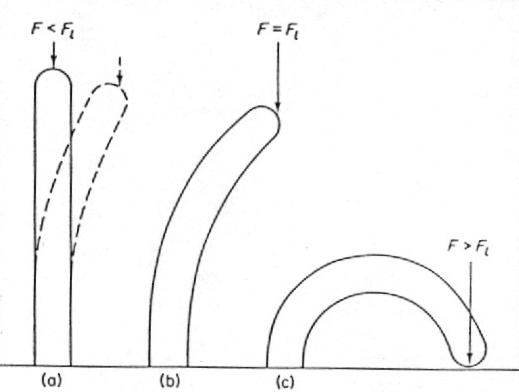
FIG. 3. Buckling due to a compressive force F. The bar in (a), when displaced, returns to its straight-line position. In (b) the straight-line position is unstable, while the deflected one is stable. When a force F exceeds the limiting force Fl the bar bends to the ground or breaks (in (c)).
We shall now study more closely the tibia of a hypothetical 140-ton animal.
When the compressing force becomes larger than the limiting value Fl the internal elastic forces of the bone will no longer balance the external load and the bone buckles. A bone of length L, modulus of elasticity E (1.7 x 10'0 N/m2) and moment of inertia I, has for Fl
Fl = p 2EI/L2
(6)(Currey, 1967). The moment of inertia is
I= p × (DO4 – Di4)/64 (7)
with DO and Di as the outer and inner bone diameters respectively (Alexander, 1968). The value for Fl becomes 1.0 ´ 106 kg, lowering, the factor of safety (with buckling usually called the factor of stability) to seven.
An ordinary buckling is not the only way to a failure of a bone. The compressive stress grows quickly on the concave side of the bone, and the bone can break without buckling very much. Currey (l967) estimated for this kind of limiting stress s
170 MPa = s + 0.01 L(A/I)1/2s s b/(s b - s ) (8)
where A, I and L are as before and s b is the buckling strength Fl /A, Fl taken from equation (6). The limiting stress s becomes 8.0 x 10⁷ N/m2, corresponding 6.8 x 10⁵ kg. The actual value of the factor of safety is, for an immobile 140-ton animal, only five (Table 1).
The equations (5) were derived from 37 species of mammals, most of which were of moderate size. Do the heaviest animals obey them? Economos (1983) suggested
TABLE 1
The heaviest load, in 106 kg (and the corresponding factor of safety) for the tibia of a 140-ton animal
|
Buckling |
|||
|
Pure compression |
ordinary |
eq. (8) |
|
|
1.4(10) 1-4(10) |
1.0(7) 2.7(19) |
0.7(5) 1.0(7) |
Mammals in general (eq. (5)) Bovidae and dinosaurs |
that the typical lengths of larger (>20 kg) mammals grow slower, with an allometric exponent of 0.27, and Alexander (1985) found limb bone lengths of dinosaurs to be shorter than the corresponding extrapolations of general mammal dimensions (5).The length of a dinosaur tibia scales as in the mammal group Bovidae (antelopes etc., see equation (18)), being about 1.5 m for a 140-ton hypothetical sauropod, the extrapolated value from (5) is 3.3 m. Although the short tibia does not buckle easily, the factor of safety stays to seven because of the stress from equation (8) (Table 1). Bone diameters behave in all cases according to equations (5).
All in all, from a bony point of view, the upper limit to terrestrial animals seems to be between 105 and 106 kg, at least. It is, in theory, possible to construct an animal with much thicker bones and a higher weight. Then there would be no need for any considerations about extra safety margins and dynamic loads. Such an animal, as we shall soon see, would be unable to move!
(B) MUSCLE STRENGTH
To have a criterion for muscle strength, let us see how an animal lying on the ground uses its muscles to get up. It is a question of torques. Let us consider the simplified situation in Fig. 4. A mass M produces a torque LMg about the joint J. The moment arm L is the distance from the centre of the mass M to the joint J. In order not to fall back on its stomach, an animal must introduce a muscle force Fm
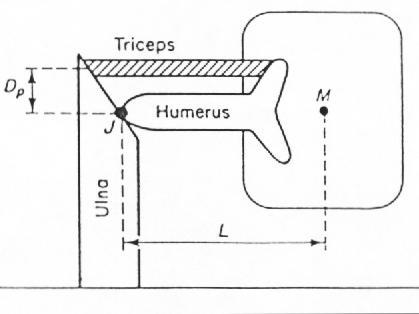
FIG. 4. Fore leg of an animal. The parameters are discussed in the text.
For torques in balance
DpFm = LMg (9)
holds, Dp being the perpendicular distance between the muscle, triceps, and the joint. The force Fm is proportional to the number of muscle cells, and so to cross-sectional area of the muscle
Fm µ Dm2. (10)
where Dm is the diameter of the muscle. Parameter Dm is not known, but can be calculated from muscle length Lm and mass Mm
Dm2 µ Mm / Lm
(11)Assuming L to be proportional to humerus length Lh and combining (9)-(11), we get for the largest mass M, the animal can handle
Mx µ Dp Mm/( Lm Lh) (12)
Table 2 lists the allometric dependencies for Dp, Mm, Lm and Lh, with 95% confidence limits. A corresponding equation for Mx becomes
Mx = aM 0.83± 0.07
(13)TABLE 2
Allometric scaling y = aMb for parameters in equation (15), with 95% confidence limits to exponent b. Body mass M is in kilogrammes, y is in millimetres or in grammes. The data is from Alexander et al (198 1), except * from Alexander et al (1979)
|
y |
a |
b |
y (M = 50 kg) |
|
|
Dp |
8.7 |
0.41 ± 0.03 |
43.3 mm |
|
|
Mm |
6.2 |
1.11 ± 0.04 |
477 g |
|
|
Lm |
18.7 |
0.33 ± 0.04 |
68.0 mm |
|
|
Lh |
51 |
0.36 ± 0.04 |
209 mm |
The pair M, Mx gives us the coefficient a. We estimate Mx for a 50kg animal, first with help from (9). The force of the triceps is
Fm = s mAm = s m Mm / (r mLm) (14)
where Am is the area of triceps cross-section, r m is muscle density 1060 kg/m3 (Mèndez & Keys, 1960) and s m is the maximum isometric stress muscle can produce, 3.0 x 10⁵N/m2 (Wells, 1965). The moment arm L is approximated to be 1.5 times Lh. The mass Mx is four times M in (9), because of the four legs of an animal, so
Mx = 4 × (Dr s m Mm)/(1.5 Lhgr mLm) (15)
Parameter values for a 50 kg animal are in Table 2, giving 110 kg as Mx. Knowing a (4.3 with exponent 0.83) and setting M = Mx = Mmax, in (13), Mmax is easily solved to give the weight of the largest four-legged mammal-like animal. The value of Mmax, 5 x 10³ kg, corresponds a male African elephant and is clearly too low, but the result is very sensitive to changes in parameters. Exponent 0.90, the biggest within the 95% confidence limits, gives 1.3 X 10⁵ kg (Mx unchanged) or 2.1 x 10⁶ kg (a unchanged) as Mmax.
The reason for small maximum mass is that we have ignored the other muscles also used in the body. In this way, the values contain some safety margin. Having made an approximation that a 50kg animal just manages to hold its mass on one bent leg – meaning 200 kg as Mx
– we would have an upper limit 1.7 x 10⁵ kg even with the exponent 0.83. Thus the order of Mmax, according to muscle strength, is again around 105-106kg. The allometric exponent for triceps mass is 1.11, so it already grows on the expense of other muscles and tissues. Although many inner organs readily become relatively smaller in bigger animals, the former example in "Qualitative mass limits" shows the difficulties in any higher muscle growth rate.It is of interest to compare (13) with results from space research. The maximum acceleration Gmax in which an animal in a centrifuge can live, scales
Gmax µ M-0.14 (16)
(Economos, 1979). Because
MGmax µ Mx µ M0.16 (17)
the adaptation to hypergravity can be explained by the allometry of muscle strength. The relationship (16) is based on few laboratory animals, each of which was under 10 kg, and is therefore of limited use in extrapolation.
(C) ANIMAL LOCOMOTION
A heavier animal, being closer to a break-down because of its relatively weaker muscles and fragile bone structure, behaves accordingly and avoids jumps and other sudden accelerations. This way it survives with its smaller factors of safety for static stress – to a certain point. In the end a massive animal is unable to take a single step without the fear of a total collapse.
Following Alexander (1977) we define the duty factor B as the fraction of the stride period that a given limb is in contact with the ground. The average force to the ground over a stride period is Mg. For one leg this force is proportional to M/B. Dividing the force to its components parallel and perpendicular to the bone, we find from (6) and (7) that the buckling limit of the parallel component is proportional to D4/L2. The perpendicular critical (bending) force is shown in standard textbooks to scale as D3/L (see Biewener, 1982 for mammal bones). The allometry of the average bone diameter D and length L need here some consideration. Because for mammals as a whole other points than running ability matter, it is reasonable to concentrate on a specialized group. Alexander el al. (1977) have studied the locomotion of African ungulates (Bovidae). As previously noted, the biggest mammals and dinosaurs seem to scale more or less similarly to this group. For Bovidae
D µ M0.36, L µ M0.26 (18)
(Alexander et al., 1979), so the perpendicular limit grows slower than the parallel one. The allometric exponents are 0.82 and 0.92, respectively. On the other hand, the angles between leg bones have a weak mass dependence (Alexander, 1977). Bigger animals, while running on straighter legs, shift stress from the perpendicular to the parallel direction of the bone. The perpendicular critical force suggests an allometric exponent 0.18 for the duty factor B – in the parallel case the exponent is 0.08. Alexander et al. (1977) found
B = aM0.14 (19)
for the hindlimbs of running ungulates, the exponent fitting well in considerations above. In their study, a 79 kg antelope ran with a duty factor 0.2, so the parameter a in (19) is about 0.11 (in fractional kg-units).
Extrapolating B to one immobilizes the animal. The corresponding mass from (19) is 7 x 10⁶ kg. Here, however, such an extrapolation is most likely misleading. The legs of an animal will soon straighten to their limits, and the exponent 0.18 begins to dominate. Using this exponent for the 79 kg antelope gives 0.09 as the coefficient a and 6 x 10⁵ kg as the ultimate mass for a movable animal. Within the approximations made, the actual mass limit seems to be around 106 kg.
A more straightforward way to the limits of animal locomotion is to look for mass dependence in their maximum velocities. Although the data available is not very accurate, Garland (1983) has plotted the velocity-mass graph, finding
log n = 1.478 + 0.259 log M - 0.062 (log M)2, (20)
where n is the maximal velocity (in km/h) of an animal weighing M (in kg). The logarithms are of base 10. A mass 106 kg allows a running speed of 6 km/h – a man could walk and overtake!
3. Discussion
In spite of the always uncertain method of extrapolating experimental laws, the various approaches give analogous results. The upper mass limits are probably underestimates, because all adaptations for high weight may not have come out. In every case, land animals bigger than 100 000 kg should be in nature’s reach – yet the largest elephants are under 10 000 kg, and the largest mammal which ever walked on solid ground, Baluchitherium, weighed about 30 000 kg (Granger & Gregory, 1935). Even the most massive land animal, the dinosaur Brachiosaurus from the Jurassic period 140 million years ago, stayed at 80 000 kg (Colbert, 1962). It has been argued that the great dinosaurs were semiaquatic because of their mass, though this has recently been questioned. From the point of view in this study Brachiosaurus could have been at least a couple of times bigger and still have walked on land.
Why, then, have there not been such gigantic animals as predicted by extrapolation? No ecosystem can support many big animals, so the number of individuals has to be small. Also the number of species reduces when animal size grows (Pianka, 1970). The bigger the animal, the fewer offspring it produces (Stearns, 1983). The time of fecundity, the age for maturity and so the regeneration time grows with size. Bigger animals use a smaller fraction of their energy for reproduction (Fenchel, 1974). In difficult conditions the ratio of reproducing individuals to the whole population is diminished, in order to save the long-living adults for better times to come (Mountford, 1970). According to their strategy, big animals count on a stable environment and give up the quick compensation for changing factors. A long – compared to the longevity of an individual – unsuitable period leads a species, from its approach to gigantism, to extinction instead.
REFERENCES
ALEXANDER, R. McN. (1968). Animal mechanics. London: Sidgwick & Jackson.
ALEXANDER, R. McN. (1977). J. Zool., Lond. 183,125.
ALEXANDEP, R. WN. (1985). Zool. J. Linn. Soc 83, 1.
ALEXANDER, R. McN., JAYES, A. S., MALOIY, G. M. 0. & WATHUTA, E. M. (1979). J. Zool., Lond, 189,305.
ALEXANDER, R. McN., JAYES, A. S., MALOIY, G. M. 0. & WATHUTA, E. M. (1981). J. Zool., Lond. 194, 539.
ALEXANDER, R. McN., LANGMAN, V. A. & JAYES, A. S. (1977). J. Zool., Lond. 183,291.
ALEXANDER, R. McN., MALOIY, G. M. 0., HUNTER, B., JAYES, A. S. & NTURIBI, J. (1979). J. Zool., Lond. 189,135.
B 1 EWENER, A. A. (1982). J. exp. Biol. 98, 289.
BIEWENER, A. A., THOMASON, J. & LANYON, L. E. (1983). J. Zool., Lond. 201, 67.
COLBERT, E. H. (1962). Amer. Mus. Novitates 2076, 1.
CURREY, J. D. (1967). J. Morphol. 123, 1.
ECON0MOS, A. C. (1979). Physiologist 22, 5.
ECON0MOS, A. C. (1983). J. theor. Biol 103, 167.
FENCHEL, T. (1974). Oecologia 14, 317.
FUNG, Y. C. (1981). Biomechanics: Mechanical Properties of Living Tissues. New York: Springer-Verlag.
GALILEi, G. (1637). Dialogues Concerning Two New Sciences. New York: Macmillan, 1914.
GARLAND, T. (1983). J. Zool., Lond. 199, 157.
GRANGER, W. & GREGORY, W. K. (1935). Amer. Mus. Novitates 787, 1.
MÈNDEZ, J. & KEYS, A. (1960). Metabolism 9, 184.
NIOUNTFORD, M. (1971). J. theor. Biol. 32,75.
MUNRO, H. N. (1969). Mammalian Protein Metabolism. New York: Academic Press.
PIANKA, E. R. (1970). Am. Nat. 104, 592.
SCHMIDT-NIELSEN, K. (1984). Scaling: Why is Anirnal Size so Important? Cambridge: Cambridge University Press.
STEARNS, S. C. (1983). Oikos 41, 173.
WELLS, J. B. (1965). J. Physiol., Lond. 178, 252.